![]()
Simon Schwartzman and Elizabeth Balbachevsky
Universidade de São Paulo| Table 9 - Average number of working hours* a week when classes are in session, by type of institution | |||||
| State (SP) | State (other) | Federal | Private | Total | |
| Teaching | 12.6 | 17.7 | 16.2 | 13.4 | 14.9 |
| Research | 12.4 | 7.1 | 8.6 | 5.3 | 8.0 |
| Services | 3.9 | 3.9 | 4.0 | 5.3 | 4.0 |
| Administration | 4.7 | 4.2 | 4.8 | 2.1 | 3.9 |
| other activities | 6.2 | 6.9 | 6.3 | 13.8 | 8.7 |
| * Answers adjusted to a standard 40 hours' week. When the total of hours reported was less than 40, the difference was attributed to "other activities"; when it was more, values were proporcionally reduced to fit the total of 40. | |||||
| Table 10: Evaluation of Working Conditions (average scores) | |||||
| State (SP) | State (other) | Federal | Private | Total | |
| a) Professional side benefits (1: excelent; 2: good; 3: regular; 4: bad, does not have it) | |||||
| Retirement Benefits**** | 2.26 | 3.68 | 2.58 | 3.72 | 3.01 |
| Sabatical leaves**** | 3.28 | 2.90 | 2.72 | 3.50 | 3.06 |
| Support for academic travel**** | 3.56 | 3.37 | 3.73 | 3.77 | 3.68 |
| fellowships and incentives for further studies*** | 3.06 | 3.04 | 3.17 | 3.36 | 3.19 |
| other benefits (medical, housing, family education, etc.)**** | 3.53 | 3.81 | 3.92 | 3.63 | 3.64 |
| b) academic environment: | |||||
| intellectual climate**** | 2.18 | 2.69 | 2.41 | 2.32 | 2.39 |
| relationships between academics and the administration* | 2.59 | 2.67 | 2.45 | 2.56 | 2.53 |
| morale among the academics*** | 2.68 | 2.85 | 2.72 | 2.51 | 2.66 |
| clarity of institutional goals | 2.70 | 2.79 | 2.74 | 2.60 | 2.70 |
| sense of community** | 3.02 | 3.00 | 2.95 | 2.76 | 2.90 |
| c) material resources and services: | |||||
| lecture rooms | 2.72 | 2.75 | 2.83 | 2.69 | 2.76 |
| technical resources for teaching**** | 2.90 | 3.24 | 3.29 | 2.94 | 3.12 |
| laboratories**** | 2.98 | 3.13 | 3.37 | 2.94 | 3.12 |
| research equipment and instruments**** | 2.92 | 3.45 | 3.49 | 3.30 | 3.34 |
| computer facilities** | 2.88 | 3.12 | 3.17 | 3.17 | 3.12 |
| library**** | 2.06 | 3.26 | 3.06 | 2.77 | 2.84 |
| offices for faculty*** | 2.80 | 3.26 | 3.10 | 3.05 | 3.06 |
| secretarial support | 2.84 | 2.91 | 3.11 | 2.61 | 2.89 |
| significance: **** : < .0001 ***: < .001 ** < .01 * < .1 | |||||
| Table 11: Your interests lie primarily in teaching or research? (percentages) | |||||
| State - SP | State - other | Federal | Private | Total | |
| primarily in teaching | 9.72 | 26.42 | 20.90 | 22.61 | 20.39 |
| both, but leaning toward teaching | 36.11 | 43.40 | 40.80 | 44.90 | 41.72 |
| both, but leaning toward research | 49.92 | 29.25 | 36.82 | 29.94 | 35.40 |
| primarily in research | 6.25 | 0.94 | 1.49 | 2.55 | 2.48 |
| Table 12: Which of the following represents your teaching responsibilities at this institution? | ||||
| State - SP | State - other | Federal | Private | |
| entirely undergraduate | 36.7 | 85.0 | 54.3 | 78.0 |
| some undergraduate, some graduate | 54.0 | |
38.9 | 17.3 |
| entirely graduate | 4.0 | 7.5 | 2.2 | 1.6 |
| not teaching this year | 5.3 | 7.5 | 4.6 | 3.1 |
| Table 13: During this academic year, when classes are in session, approximately how many hours a week to you spend teaching at this institution | ||||||
| Group Instruction | Individualized Instruction | |||||
| N | average | N | Average | |||
| State, SP | 142 | 8.7535 | 135 | 4.3926 | ||
| State, other | 101 | 12.3465 | 86 | 6.4070 | ||
| Federal | 383 | 10.7415 | 346 | 5.7572 | ||
| Private | 301 | 11.9236 | 199 | 5.1156 | ||
| Table 14: As a general rule, which of the following activities do you require of your students for successful completion of a course? (percentage requiring) | ||
| Undergraduate (n=921) | Graduate (n=324) | |
| attend classes regularly | 77.7 | 64.6 |
| write several short papers | 55.0 | 40.8 |
| write a major paper | 47.7 | 67.0 |
| make a formal oral presentation | 41.8 | 63.6 |
| participate actively in class discussion | 66.3 | 68.8 |
| take a single examination | 10.2 | 19.4 |
| take two or more examinations | 65.9 | 30.9 |
| no specific requirements | 1.8 | 1.9 |
| Table 15: What do you think students should learn in your courses? (percentages stating it as first priority) | ||
| undergraduate | Graduate | |
| Facts, information | 49.6 | 37.7 |
| Theories, concepts, paradigms | 23.5 | 29.3 |
| Research methods | 4.0 | 16.0 |
| professional competence for problem solving | 1.1 | 5.2 |
| others | 10.7 | 11.7 |
| Table 16: Please indicate the way your teaching is influenced by the following circumstances (1, strong positive; 5; strong negative influence) | ||||||
| State, SP | State, other | Federal | Private | Total | significance(1) | |
| The number of course I am assigned to teach | 2.66 | 3.16 | 2.64 | 2.77 | 2.69 | ** |
| the number of students enrolled in my classes | 3.05 | 3.32 | 2.96 | 3.29 | 3.12 | * |
| eaching facilities and resources here | 2.89 | 2.97 | 3.44 | 2.90 | 3.13 | **** |
| my administrative work | 3.84 | 3.53 | 3.38 | 3.22 | 3.43 | **** |
| the availability of research funding | 3.20 | 3.65 | 3.60 | 3.25 | 3.43 | ** |
| my non-academic professional activities | 2.38 | 2.80 | 2.59 | 2.27 | 2.48 | ** |
| Table 17: Statements about teaching conditions at the institution (1: agree; 5: disagree). | ||||||
| *student opinions should be used in the evaluation of teaching effectiveness | 1.80 | 1.68 | 1.65 | 1.50 | 1.65 | * |
| the pressure to publish reduces the quality of teaching | 3.52 | 4.22 | 4.07 | 4.06 | 3.98 | **** |
| we need better ways to evaluate teaching performance | 1.89 | 1.68 | 1.70 | 2.05 | 1.84 | ** |
| teaching effectiveness should be the primary criterion for promotion of faculty | 3.46 | 2.59 | 2.65 | 2.33 | 2.67 | **** |
| (1) Significance: ****: <.0001 ***: <.001 **: <.01 *: < .1 | ||||||
| Table 18: Please give your opinion about the ability and performance of the undergraduate students of your institution (1: agree; 5: disagree) | ||||||
| State, SP | State, others | Federal | Private | Total | significance (1) | |
| they are adequatedly prepared in written and oral communication skills | 4.17 | 4.43 | 4.33 | 4.41 | 4.34 | |
| they are adequatedly prepared in mathematics and quantitative reasoning skills | 3.57 | 4.0 | 3.92 | 4.08 | 3.05 | ** |
| they do just enough to get by academically | 2.88 | 2.05 | 2.58 | 2.28 | 2.47 | **** |
| they are willing to cheat to get good grades | 3.21 | 2.84 | 3.14 | 2.56 | 2.94 | **** |
| they are more studious than the students I had five years ago | 3.76 | 4.22 | 3.75 | 4.16 | 3.0- | *** |
| faculty should spend more time with students outside the classroom | 2.06 | 2.05 | 1.94 | 2.05 | 2.01 | |
| (1) Significance: ****: <.0001 ***: <.001 **: <.01 *: < .1 | ||||||
| Table 19. Research activity, by institutional context and academic degree. | |||||
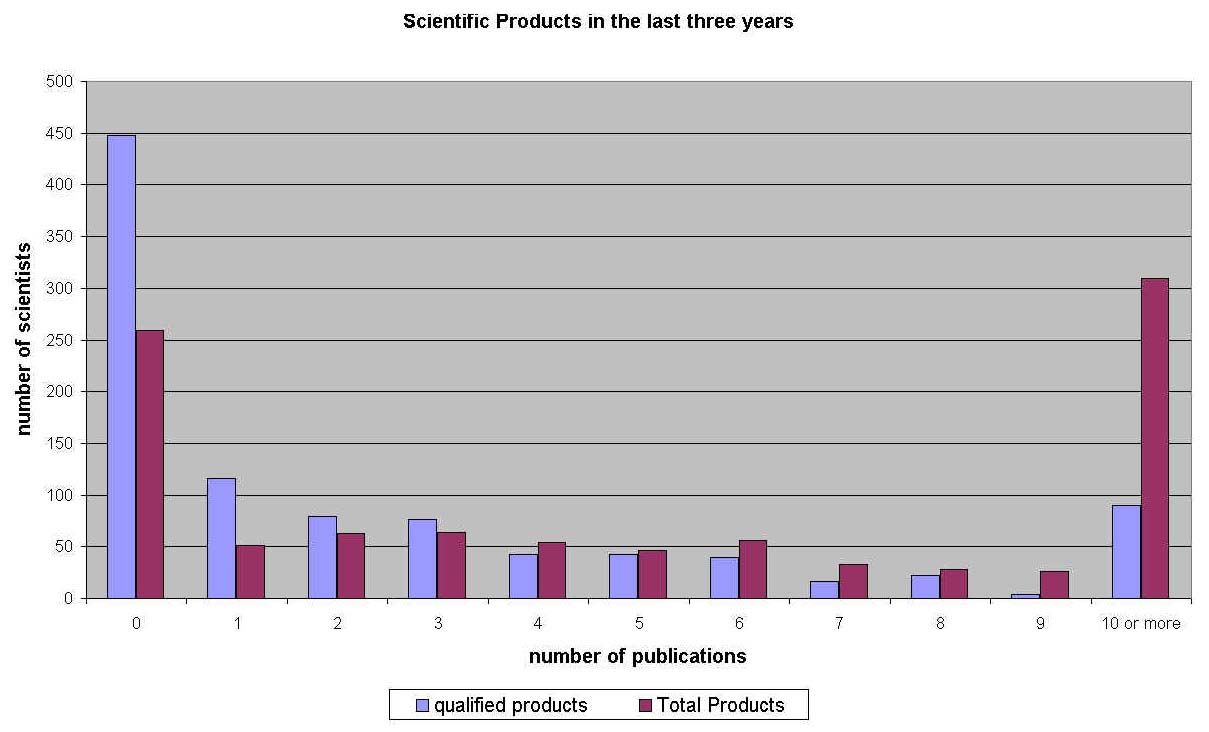
| The contract with the institution requires research | Is engaged in some kind of research | In the last three years : | |||
| received some kind of financial support for research | had one or more qualified scientific product(*) | had one or more product of any kind (**) | |||
| Total | 52.9% | 63,8 | 31,5 | 54.7 | 75,9 |
| Institutional context | |||||
| State (SP) | 91.0 | 93,2 | 49,7 | 82,8 | 94,7 |
| State (other) | 44.0 | 53,8 | 20,6 | 38,5 | 64,2 |
| Federal | 65.0 | 72,8 | 33,8 | 57,2 | 80,3 |
| Private | 22.9 | 41,4 | 23,4 | 43,7 | 65,4 |
| Academic degree | |||||
| undergraduate | 30.2 | 42.9 | 14.7 | 37.6 | 59.0 |
| specialization | 31.0 | 40.7 | 11.6 | 33.0 | 63.3 |
| master's degree | 64.3 | 70.0 | 61.3 | 83.7 | 96.2 |
| Doctor's degree | 80,2 | 91,6 | 61,3 | 83,7 | 96,2 |
| Associate and full professor | 61,8 | 77,3 | 42,7 | 76,2 | 86,4 |
| * scholarly books authored, articles in academic books or
journals, patents secured, artistic work performed or exhibited, video or
film produced. ** all of the above, scholarly books edited, research reports, papers presented to conferences, professional articles for newspapers and magazines, computer programs for public use, and others. |
|||||
| Table 21: Total amount of research funding received in the last three years. | |||
| Frequency | percent | cumul % | |
| less than US$ 5.000 | 137 | 46.3 | 46.3 |
| 5 to 24.9 | 92 | 31.1 | 77.4 |
| 25 to 49.9 | 28 | 9.5 | 86.8 |
| 50 to 99.9 | 15 | 5.1 | 91.9 |
| 100 to 249.9 | 15 | 5.1 | 97.0 |
| 250 to 499.9 thousand | 3 | 1.0 | 98.0 |
| more than US$ 500 thousand | 6 | 2.0 | 100.0 |
| Total | 302 | 100.0 | 100.0 |
| Table 22: Source of financing: Multiple answers): | ||
| Total | Percentages | |
| From the institution where I work: | 133 | 34.4 |
| From Brazilian goverv. agencies | 237 | 61.2 |
| from Brazilian companies | 35 | 9.8 |
| from Brazilian private foundtions | 23 | 5.9 |
| from international agencies | 35 | 9.0 |
| from foreign governm agencies | 39 | 10.1 |
| from multinational companies | 20 | 5.2 |
| from foreign private foundations | 13 | 3.4 |
| from other sources | 15 | 3.5 |
| N: 387 | ||
| Table 23: Grant values for those receiving from one source only (main sources): | ||
| Own Institution (%) | Brazilian Government (%) | |
| less than US 5.000 | 100% | 48.7 |
| between 5 and 24.999 | 33.0 | |
| between 25 and 49.999 | 6.1 | |
| more than 50 thousand | 7.8 | |
| N | 17 | 110 |
| Table 24: scientific production and finantial support, by organization of research work | ||||
| Works in research in teams | Does individual research | does not research now | Total | |
| Scientific production with finantial suport | 41.9% | 18.0% | 3.4% | 24.9% |
| scientific production without finantial support | 29.5 | 46.9 | 26.9 | 31.0 |
| no scientific production in the last three years | 28.6 | 35.2 | 67.7 | 44.1 |
| Total (100%) | 465 | 128 | 327 | 920 |
| Table 25: Indicate the way your academic research is influenced by the following circumstances (mean scores: 1 - strong positive influence: 5 - strong negative influence) | |
| the availability of research funding | 3.54 |
| facilities and resources for research here | 3.34 |
| the number of courses I am assigned to teach | 3.16 |
| the kinds of courses I am supposed to teach | 2.59 |
| the number of students enrolled in my classes | 3.11 |
| the quality of students available as research assistants | 2.76 |
| the amount of student advising I do | 2.84 |
| my non-academic professional activities | 2.90 |
| my administrative work | 3.60 |
| valid cases: | 545 |
| Table 26: With which kinds of organizations have you worked in the past year (includes paid and unpaid consulting work, public and volutary service) - multiple responses | ||
| N | % | |
| Business, Industry | 223 | 30.49% |
| Educational Institutions | 341 | 47.30% |
| Local Government | 318 | 44.11% |
| National Government | 206 | 28.57% |
| Private, social service | 62 | 8.60% |
| International govern bodies | 39 | 5.41% |
| other int. institutions | 38 | 5.27% |
| other | 98 | 13.59% |
| TOTAL | 721 | 100.00% |
| Table 27: Services and extension work | |||||
| does not provide services to institutions | believes that: | ||||
| faculty has an obligation to apply knowlege to problems of society | services are a distraction which competes with essencial work | paid consulting work is economically necessary | service is important for faculty evaluation | ||
| Type of Institution | |||||
| State, SP | 11.3% | 64.2 | 11.9 | 25.2 | 39.1 |
| State, other | 22.2% | 77.1 | 19.3 | 34.9 | 35.8 |
| Federal | 26.8 | 68.1 | 13.4 | 31.9 | 38.9 |
| Private | 23.9 | 67.0 | 10.4 | 41.2 | 29.6 |
| Fields of knowledge | |||||
| basic sciences | 29.8 | 58.3 | 14.5 | 21.1 | 28.9 |
| social sciences | 25.1 | 74.7 | 12.0 | 59.9 | 38.0 |
| humanities | 20.1 | 62.1 | 9.1 | 25.1 | 32.9 |
| technology | 20.5 | 77.1 | 10.8 | 53.0 | 34.9 |
| health | 12.8 | 73.4 | 17.6 | 31.4 | 45.2 |